Observability
Orrery ships three correlated signals, all wired globally through default_plugins() — no per-agent setup:
| Signal | What it answers | Backend |
|---|---|---|
| Metrics | How much? How often? — call rates, latency, errors, tokens | Prometheus (/metrics) |
| Traces | Where did a single request spend its time? | OpenTelemetry → Tempo / Jaeger |
| Logs | What happened, line by line, correlated to a trace | Structured JSON → Loki / Cloud Logging |
Metrics are on by default; tracing is an opt-in extra. The two share a Grafana stack you can bring up with make up PROFILES=tracing.
Metrics
The platform exposes Prometheus metrics for every tool call across all agents — real-time visibility into tool latency, error rates, agent usage, and circuit-breaker state.
Quick start
Metrics are enabled automatically via default_plugins() — no per-agent wiring needed:
from orrery_core import MetricsPlugin, default_plugins
from google.adk.runners import Runner

plugins = default_plugins()
runner = Runner(
    agent=root_agent,
    app_name="my_agent",
    session_service=session_service,
    plugins=plugins,
)

# Expose /metrics on port 9100 (call once at startup).
# The Slack and Google Chat bots do this in their FastAPI lifespan.
metrics_plugin = next(p for p in plugins if isinstance(p, MetricsPlugin))
metrics_plugin.start_server()
default_plugins() does not auto-start the metrics server
The MetricsPlugin is registered, but the /metrics HTTP server is only started when a host calls start_server() explicitly. This is intentional — the ADK CLI and tests don't want a port binding. The Slack bot (agents/slack-bot/slack_bot/app.py) and Google Chat bot start it in their FastAPI lifespan; the persistent runner starts it when ENABLE_METRICS_SERVER=true.
Available metrics
All metrics use the orrery_ namespace prefix following Prometheus naming conventions.
| Metric | Type | Labels | Description |
|---|---|---|---|
orrery_tool_calls_total | Counter | agent, tool, status | Total tool invocations with bounded status values |
orrery_tool_duration_seconds | Histogram | agent, tool | Tool execution latency (buckets: 50ms to 60s) |
orrery_tool_errors_total | Counter | agent, tool, error_type | Errors broken down by exception type |
orrery_circuit_breaker_state | Gauge | tool | Circuit breaker state: 0=closed, 1=open, 2=half_open |
orrery_llm_tokens_total | Counter | agent, direction | LLM token consumption (input/output) |
orrery_context_cache_events_total | Counter | event | Context cache hits and misses |
orrery_context_compaction_total | Counter | — | Conversation histories compacted into a summary |
orrery_safety_screen_total | Counter | direction, source | Prompt-injection screening engagements |
orrery_confirmations_raised_total | Counter | tool, mode | Guarded calls paused for human approval |
orrery_confirmations_decided_total | Counter | tool, decision | Decisions the gate accepted |
orrery_confirmations_refused_total | Counter | tool, reason | Decisions the gate rejected |
orrery_confirmations_expired_total | Counter | — | Pendings that aged out unanswered |
orrery_confirmation_decision_seconds | Histogram | tool | How long humans take to decide |
The status label on orrery_tool_calls_total is restricted to a fixed set — ok, success, error, confirmation_required — to prevent cardinality explosion; any other value is normalised to ok.
Watch orrery_context_compaction_total against the cache counter: each compaction rewrites the history and so invalidates the cached prefix. A rising compaction rate alongside a falling cache-hit rate means ORRERY_COMPACTION_TOKEN_THRESHOLD is set too low.
orrery_safety_screen_total counts the injection screen engaging, which is the control working rather than a breach — a direct hit was refused before it cost a token, an indirect one had only the matched span replaced. The direction label separates two findings that must not be summed: direct (source="user_message") means someone is probing the agent, while indirect (source=<tool>) means attacker-reachable text is sitting in the monitored infrastructure, which is a finding about that system. Indirect hits count spans, not events: two injected lines in one payload is a worse finding than one.
The confirmation counters (AEP-024) record a gate that was already correct but silent. orrery_confirmations_refused_total{reason="not_requester"} is the one to alert on: someone other than the requester attempting to approve a guarded action is either a confused operator or an attempt to escalate, and before these counters existed it left no trace anywhere. reason is a bounded enum — not_requester, unknown_requester, stale_decision, no_pending — so it aggregates. The mode label on the raise counter distinguishes requester_verified from scoped transports, which is what lets an auditor tell a human-approved production change from a model re-call on a dev surface.
How it works
MetricsPlugin wraps MetricsCollector and registers as a global plugin on the Runner, implementing three callbacks:
before_tool_callback— generates a unique invocation ID and starts a timerafter_tool_callback— records duration and success/error statuson_tool_error_callback— records error type, duration, and increments error counters
Since plugins apply globally, metrics are collected for every tool across every agent automatically. default_plugins() also wires the ResiliencePlugin's circuit breaker into MetricsPlugin, so orrery_circuit_breaker_state tracks state changes per tool. For LLM tokens, call track_llm_tokens("my_agent", input_tokens=150, output_tokens=300) from a model callback — when tracing is enabled, TracingPlugin does this for you (see below).
Configuration & scraping
| Environment Variable | Default | Description |
|---|---|---|
METRICS_PORT | 9100 | TCP port for the /metrics HTTP server |
infra/prometheus.yml includes a pre-configured scrape job. For local development (agent on host, Prometheus in Docker) it targets host.docker.internal:9100; for an in-cluster Docker deployment, point it at the service names (orrery-assistant:9100, slack-bot:9100). The compose Prometheus service sets extra_hosts: ["host.docker.internal:host-gateway"] so the local config works on Linux.
Example PromQL
rate(orrery_tool_errors_total[5m])                                   # tool error rate (5m)
histogram_quantile(0.95, rate(orrery_tool_duration_seconds_bucket[5m]))  # p95 latency
rate(orrery_tool_calls_total[1m]) * 60                               # calls/min by tool
orrery_circuit_breaker_state == 1                                    # breakers currently open
increase(orrery_llm_tokens_total[1h])                                # tokens/agent, last hour
sum by (source) (increase(orrery_safety_screen_total{direction="indirect"}[15m]))  # injected text by tool
increase(orrery_confirmations_refused_total{reason="not_requester"}[1h])  # unauthorized approvals
Distributed Tracing
Metrics tell you how much and how often; traces tell you where a single request spent its time. ADK 2.0 already emits native spans for every agent, tool, and LLM call — orrery configures the exporter and enriches those spans rather than creating duplicates.
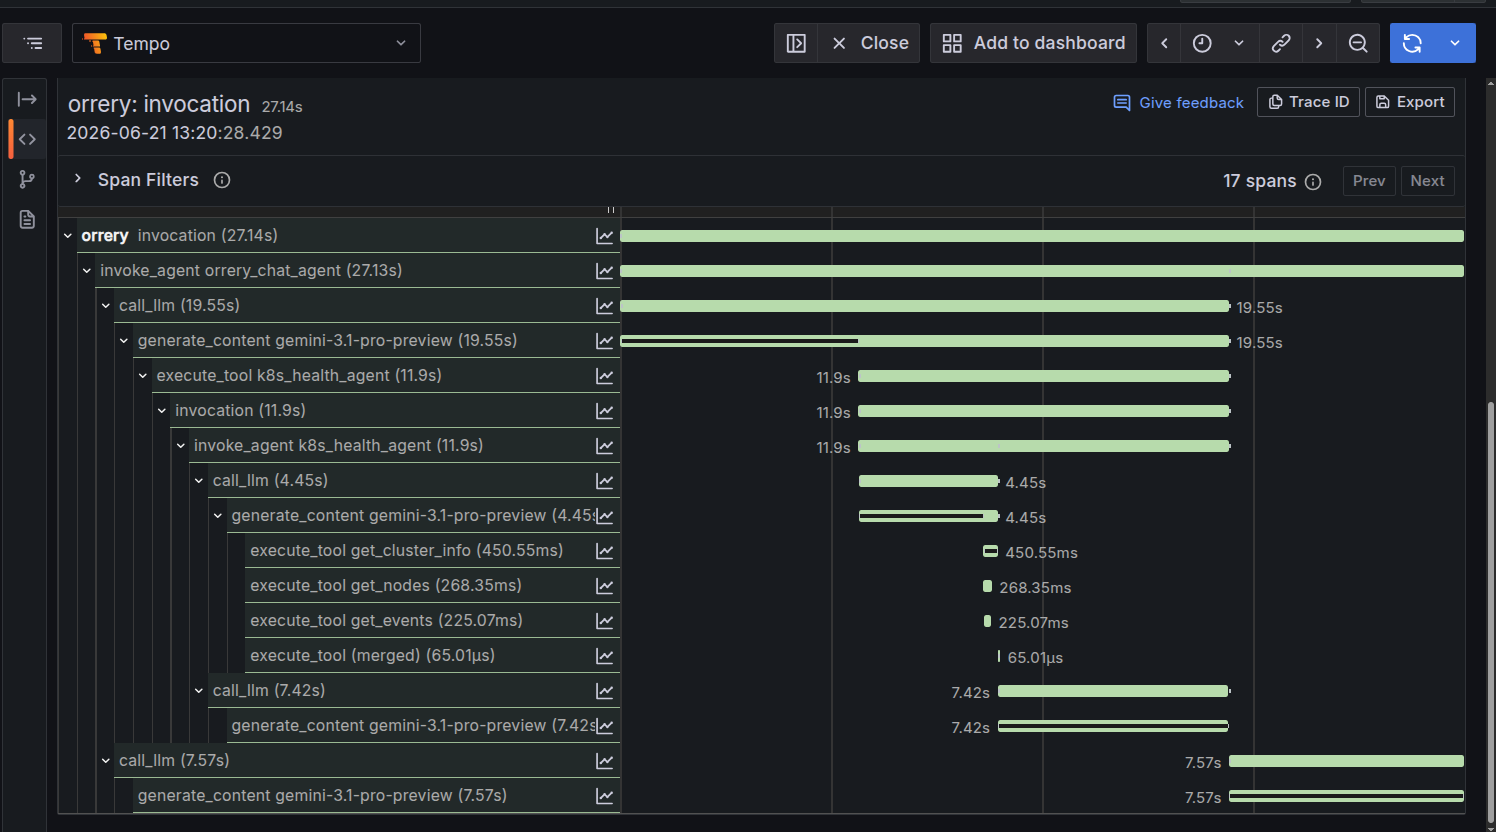
A real orrery turn in Grafana Tempo: the 27s invocation fans out through orrery_chat_agent → call_llm → the k8s_health_agent AgentTool → its own call_llm and execute_tool spans (get_cluster_info, get_nodes, get_events). The span widths make the latency hotspot obvious at a glance.
Enable it
Install the extra and flip one env var:
uv sync --extra otel
export OTEL_TRACING_ENABLED=true
export OTEL_EXPORTER_OTLP_ENDPOINT=http://localhost:4317   # omit to print spans to the console
default_plugins() reads OTEL_TRACING_ENABLED and prepends TracingPlugin automatically, so every transport (Google Chat, Slack, the HTTP server, the persistent runner) picks it up — no per-agent wiring. A missing [otel] extra is a skip-with-warning, not a crash. The full env-var table lives in Configuration → Distributed Tracing.
What the spans carry
TracingPlugin annotates the active span (never a duplicate) with:
orrery.request_id,orrery.user_roleorrery.tool.name,orrery.tool.status,orrery.tool.result_size- exceptions recorded with
ERRORstatus on tool/model failures
LLM token counts ride on ADK's native gen_ai.usage.* attributes; TracingPlugin bridges them into the orrery_llm_tokens_total metric so traces and metrics always agree.
Log ↔ trace correlation
Every JSON log line emitted while handling a request carries request_id, plus trace_id / span_id when a span is active — so you can pivot from a log line straight to the matching trace in Tempo/Jaeger. request_id works even without the otel extra installed.
Local stack: Tempo + Grafana
make up PROFILES=tracing starts Tempo (OTLP ingest + storage) and Grafana under the tracing compose profile:
make up PROFILES=tracing                                      # Tempo :4317/:3200, Grafana :3001
OTEL_TRACING_ENABLED=true \
OTEL_EXPORTER_OTLP_ENDPOINT=http://localhost:4317 \
make run-dev                                   # spans flow to Tempo
make down
Open Grafana at http://localhost:3001 (anonymous admin). It ships with two provisioned artifacts:
- Datasources — Tempo (traces) and Prometheus (metrics), with the trace→metrics link pre-wired so you can pivot from a span to the
orrery_*metrics for its service. - Dashboard — Orrery — Agent Observability (in the Orrery folder): tool call rate, p95 latency, error rate by type, LLM tokens/s, circuit-breaker state, and a live table of recent
service.name = orrerytraces. Click any Trace ID to open the full span tree — slow turns are usually dominated by a single largecall_llmspan, which is the cue to trim what a tool feeds back to the model.
Where it runs
All agents get metrics (and tracing, when enabled) automatically through default_plugins() on the Runner — no per-agent setup.
| Deployment | Metrics server | Tracing |
|---|---|---|
| CLI / persistent runner | metrics_plugin.start_server() | OTEL_TRACING_ENABLED=true |
| Slack / Google Chat bot | Started in FastAPI lifespan on :9100 | env-driven, per transport |
| Docker demo | Exposed on :9100, scraped by Prometheus | point OTLP at Tempo |